

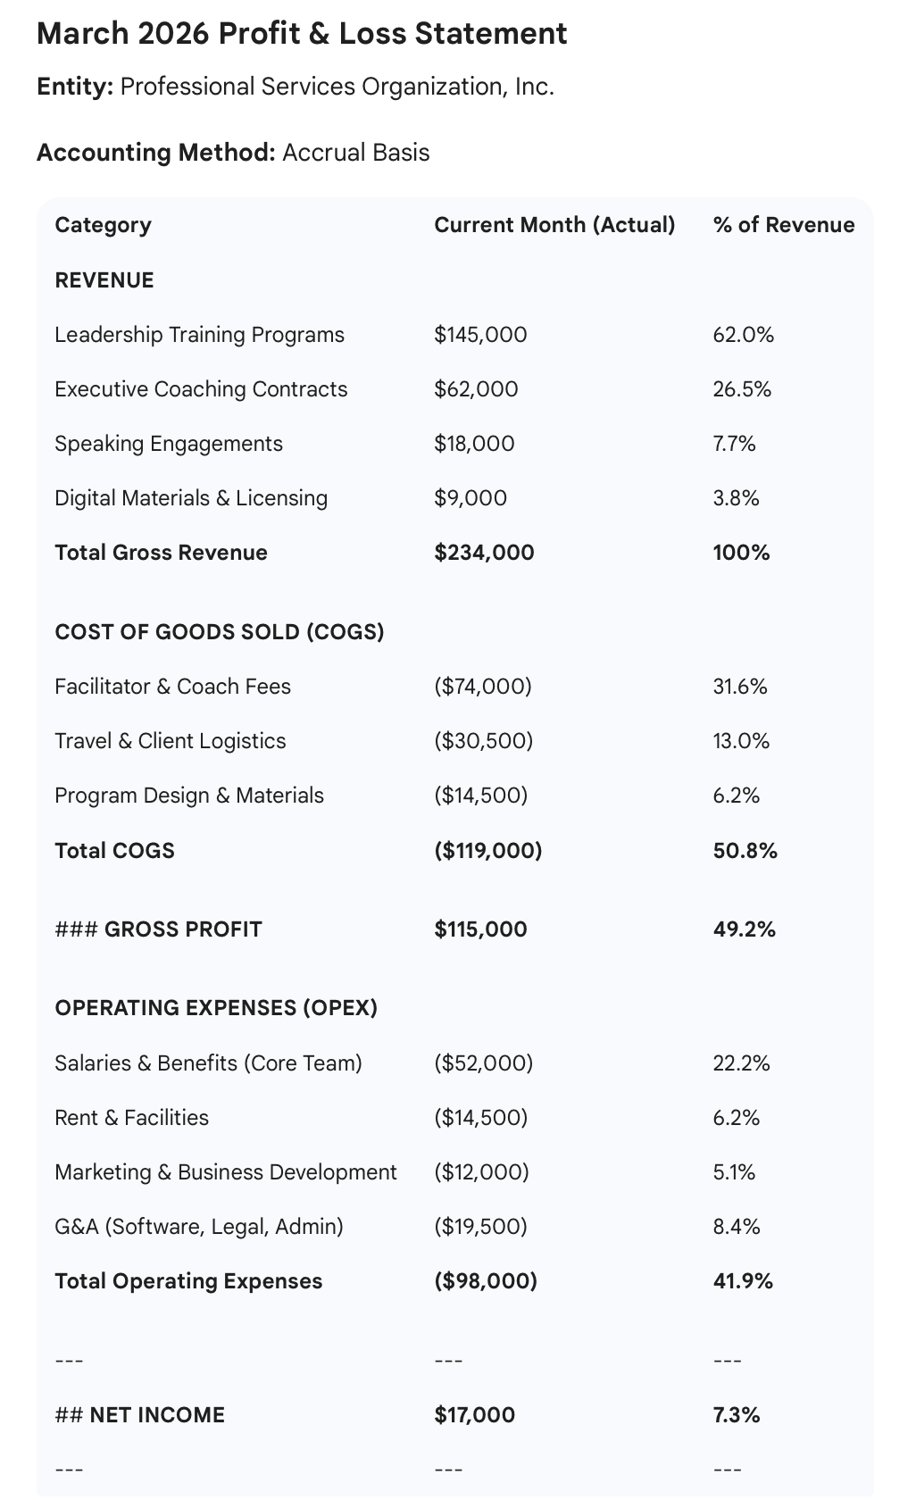
In short: A P&L statement shows whether an organization made or lost money over a period. Read it top to bottom - revenue, cost of goods, gross profit, operating expenses, and the bottom line - and watch the trend.
Entrepreneurship, climbing a career ladder, and creating impact all require financial literacy at some point in a successful career. This series covers the basics of reading and building financial statements for non-financial leaders and how to use the information packaged in those statements.
For clarity, I am not a financial advisor nor do I have formal training as an accountant. I've negotiated multi-billion-dollar budgets as Chair of the House Appropriations Committee and Speaker of the Vermont House, and served on nonprofit boards managing finances from $150K to $35M. I've navigated budgets in small businesses, rental properties, and nonprofits, and teach public budgeting and management to Master's students in Public Policy and Administration. Growing up in a multi-generational manufacturing business, with a father whose love language was financial literacy, I learned early that understanding numbers is essential to effective decision making. You don't need to be formally trained as an accountant - but you do need comfort with financial realities. I have spent my career translating complex financial information into actionable strategy.
Please contact licensed professionals for financial and accounting advice. This article is for the many leaders I've met in politics, business, and non-profits who were limited in their influence and effectiveness because they did not have a working understanding of these tools.
What Does a P&L Actually Tell You?
P&L statements - also called income statements - are a time-defined snapshot. They capture the difference between the money that came in (revenue) and the money that went out (expenses), as well as categories of each. Combined with cash flow statements and balance sheets, P&Ls paint a picture of an organization's financial health and stability. For leaders and managers, they are an essential tool for decision-making, improving financial sustainability and profitability, and tracking business performance.
A P&L is a decision-support tool. Leaders use it to understand whether the current way of operating is viable, where pressure is building, and what tradeoffs may be required. Reading it well allows you to participate credibly in strategic conversations.
How to Read a Profit and Loss Statement
P&Ls summarize the actual income brought in and expenses paid out over a stated time period. The key sections to understand are:
Time Period
Listed just under the heading, this is most often a month, quarter, year-to-date, or a full year. A longer time period provides a more complete picture and levels out normal seasonal fluctuations. Comparing shorter periods, such as back-to-back months, or last year's September with this year's, can reveal emerging patterns and year-over-year changes.
Avoid overreacting to a single short-period result. Ask questions to understand the context and dynamics. A weak month may reflect timing or seasonality. Conversely, strong short-term results may mask longer-term risks. The question to ask: What patterns emerge when I zoom out, and what decisions made earlier are showing up now?
Revenue
Revenue represents the total money brought in during the period. I'm deliberately avoiding the word "income" here, because that term often refers to profit - what remains after expenses are deducted. Total revenue appears at the top of the statement, which is why it's also called the "top line" or "gross revenue."
To understand revenue fully, find out whether this is a cash or accrual accounting system. Revenue is recorded differently based on this choice. A cash system records income when money is received; an accrual system records it when it is earned.
Consider a small, locally-owned coffee shop: their income is largely earned and paid for the same day, so in simplistic terms, their revenue would look similar in both systems. In contrast, in my consulting world, I often deliver coaching and training in one month, bill at month's end, then receive payment the following month. A 10-day onsite visit with a client in February would show up on February's statement in an accrual system - even though I hadn't yet been paid - but would appear on March's statement in a cash system.
Revenue categories depend on the type of business or organization. They might include sales, rentals, services, and passive income like interest, dividends, and royalties. KS-Insight tracks coaching, leadership training, management programs, and retreat facilitation. Revenues in the non-profit sector often include donations, grants, events, or various service fees.
Understand when and why it appears. Accrued revenue may look strong even when cash has not yet arrived, creating short-term pressure in cash flow. Ask whether revenue growth reflects sustainable demand, one-time events, or delayed payments - and align staffing and spending decisions accordingly. How does the YTD (year-to-date) revenue compare with the revenue projections on which the current year's budget is based? What hypothesis do the sales or finance teams have for any discrepancies?
Cost of Goods Sold
Cost of Goods Sold (COGS) measures the direct cost of production, such as raw materials in manufacturing, ingredients in a restaurant, and the direct labor used in production. It is a formal accounting tool with tax implications that focuses attention on inventory expenses and "gross profit."
Service-based entities, such as law offices, consulting firms, or counseling agencies, do not typically report COGS, and can use "cost of services" to separate direct and indirect costs of business. Business operations that blend inventory-based and service-based business, such as a hotel with a restaurant and gift shop, often use COGS in financial statements and for tax purposes.
Gross Profit vs. Net Profit (and Why the Difference Matters)
Gross profit is calculated as total revenue minus cost of goods sold (COGS). Gross profit shows how much money remains after covering core delivery costs, before overhead is factored in.
Net profit is total revenue minus all expenses. It reflects overall financial sustainability after operating and administrative costs are included.
Gross profit is an early warning system. Declining gross margins often signal pricing problems, inefficient delivery, or scope creep long before net profit turns negative. Net profit alone can hide structural issues that make future growth risky or unsustainable.
Expenses
These are all costs of doing business: salary, benefits, rent or mortgage, utilities, supplies, travel, event space and catering, professional services like legal advice or accounting, and cost of business inputs or merchandise sold. As with revenue, expenses are subject to cash versus accrual timing - recording costs when incurred versus when actually paid.
Operating expenses support day-to-day functioning. Within these, fixed costs remain relatively stable regardless of activity levels, while variable costs rise or fall with volume.
Expenses are where most leaders have direct influence. Staffing decisions, vendor choices, travel policies, and workflow design all show up here. Fixed costs - such as leases, insurance, or salaries - do not change based on the amount of business done. Variable costs change with output: materials in manufacturing, travel costs for client visits, or ingredients in a restaurant.
Get to know which expenses are fixed versus variable and which costs you can realistically influence in the short versus long term. The fixed/variable distinction helps avoid false solutions. Cutting variable costs may provide short-term relief but leave structural problems untouched. Fixed costs require strategic decisions. Focus on cost structure.
Net Income
Net income is total revenue minus total expenses - the "bottom line," named for its position at the bottom of the page. If this number is positive, the organization has a profit for that period. If negative, expenses exceeded revenue, resulting in a loss.
Net income should be read in context. A temporary loss may reflect deliberate investment or timing effects, while a modest profit may conceal fragility. Pair net income with trend analysis and cash awareness before drawing conclusions.
How to Analyze a P&L for Trends
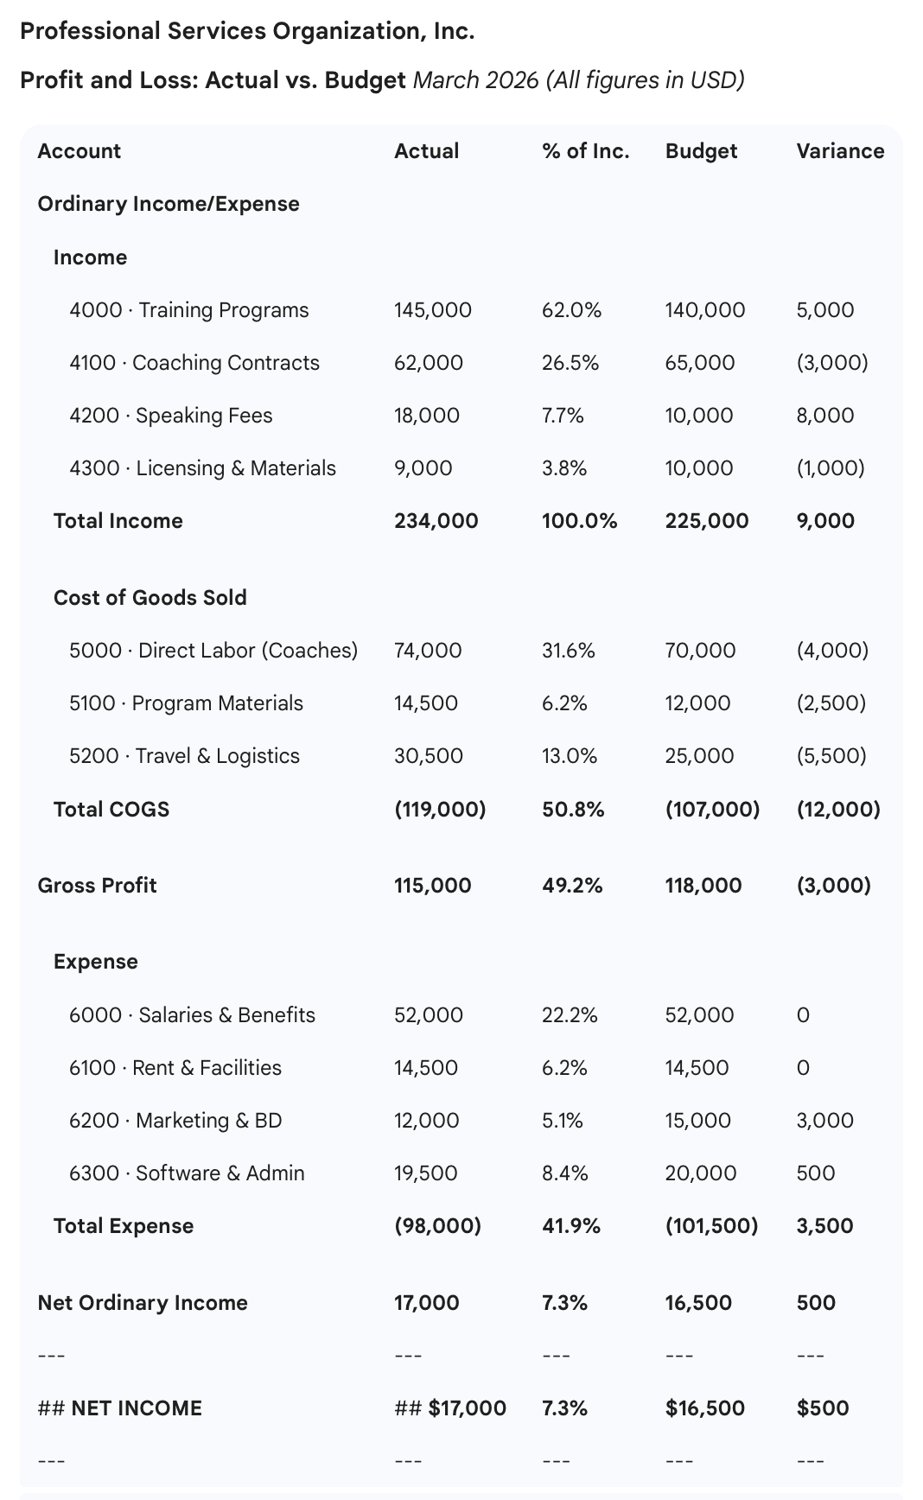
Trend analysis compares P&Ls across periods to reveal growth, contraction, margin changes, and cost drifts. The variance report above shows one approach: comparing actual results against budget to identify where reality diverged from expectations.
Trends show whether current results are anomalies or signals. Strategic decisions should be based on direction and momentum. Ask yourself: If this pattern continues, what becomes unsustainable, or what becomes possible?
What a P&L Does Not Tell You
A P&L does not show cash timing, balance sheet risk, or root causes for changes. It tells you what happened financially during a period, but not necessarily why - and it won't reveal whether you have the cash on hand to pay next week's bills.
Treat the P&L as a starting point for inquiry. Financial data must be paired with operational context and judgment.
How Can I Practice?
One of the best ways to build financial literacy is to practice with lower stakes before you need these skills professionally. Set up a P&L for your own finances. Excel is handy, but paper and pencil work just fine if you're more comfortable starting there.
Define a time period - monthly statements are a good place to start. Begin with all sources of income: gross income (before paycheck deductions), side hustles, earnings on bank accounts or investments, and one-time income like bonuses or items sold online.
Next, tackle expenses: both ongoing costs like housing, utilities, groceries, and debt payments, and one-time costs like gifts or car repairs. Look at the net - what does that tell you about your own financial situation?
String together twelve in a row and you've created an annual P&L for your household, which will give you additional information about trends in your income and spending over the year.
Why Does This Matter?
Financial literacy matters for sustainability, advancement, and decision-making.
Financial literacy expands a leader's influence. Leaders who can read and explain a P&L clearly are better equipped to make defensible decisions, earn trust across functions, and steward organizations toward long-term sustainability. You don't need to become a CFO - but you do need to be able to sit at the table and engage credibly when the numbers come out.
Explore more leadership resources from KS Insight →